Square Root N Sampling
My introduction to the technique
In the building automation world “install” jobs require technicians to validate installed devices are fit for purpose. It’s slow, and therefore expensive. At a particular hospital build I was attached to there were so many devices to install that a complete check would delay the opening of the hospital.
A guy who’s job I wanted suggested that we only check \(\sqrt{N}\)1 devices, justifying it as a statistically reasonable way to sample from a population. If you check that many, you can reason about the remaining population with a minimally-sufficiently powerful sample size. That was the rough reasoning, anyway. This allows you to check 10 things instead of 100, open the hospital on time, and send those technicians somewhere else. It’s a huge win for everyone.
Does it makes sense, though?
I’ve checked into this argument a bit. The Wikipedia page describes it as math used by the security-theatre industry1, which increased my skepticism drastically. This prompted me to do a broad web search to find criticism.
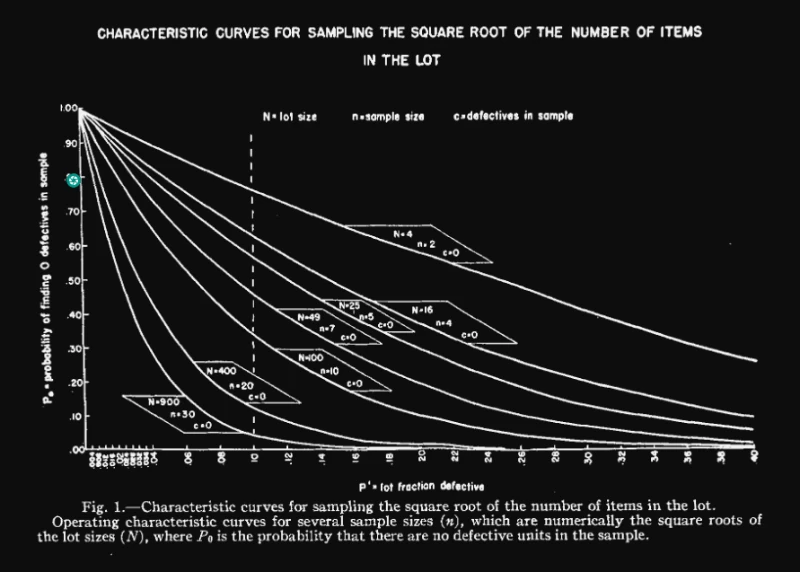
A random website2 that ranks well for \(\sqrt{N}\) skepticism thinks that it’s unsupported yet often used bullshit that is at least as old as 1920 and academically disputed by 1950. That disputing paper3 makes a compelling argument that lot size (i.e. big N)4 has little bearing on what the appropriate sample size is.

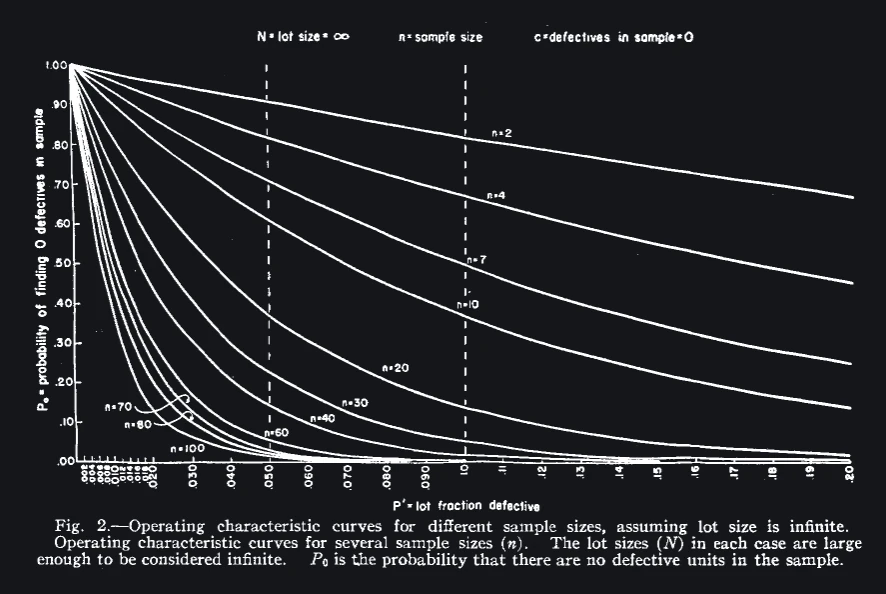
I think a clear suggestion from the chart alone is that the size of your sample matters. You can’t learn much about any population with a sample size of 3 unless the distribution you’re sampling from is extremely tight. The authors make their point about the relative irrelevance of lot size by producing the same chart except with a constant lot size of infinity.

As they say in the paper:
a great increase in lot size, i.e., from a comparatively small number to practical infinity, makes a relatively small difference in the probability of finding no defectives in the sample. This is particularly striking in the case of sample size n = 2; when the lot size is increased from 4 to infinity … the probability of finding no defectives, in a 10 per cent defective lot, increases only from P_0= 0.76 to P_0 = 0.82.
If your sample size is 2, the probability that you’ll fool yourself with this sampling technique changes by only 6% over a lot size range from 4 to infinity. Therefore, lot size is a dumb thing to use for determining your sample size, QED.
What do?
If you’re doing anything particularily serious where the consequences of a false negative are dire then you’ll be doing a statistical power analysis to find out your appropriate sample size. However, for less serious things, Fig 2 above provides some guideline. It marks a 5% and 10% defect rate as vertical lines, and you can see at a glance the probability of you bullshitting yourself with different sample counts on the various curves.
For example for a 5% defect rate and a sample size of 2 the probability of bullshitting yourself is above 90%. For the n = 30 sample size that is a somewhat accepted minimum in psychology, the probability drops to about 25%. This chart summarizes at a glance the potential consequences of different sample sizes when used for acceptance testing. It doesn’t replace power analysis, but it’s better than basing it on a function of lot size.
-
https://en.wikipedia.org/wiki/Square_root_biased_sampling ↩︎ ↩︎
-
https://variation.com/square-root-of-n-plus-one-sampling-rule/ ↩︎
-
https://sci-hub.se/https://doi.org/10.1002/jps.3030390704: “It is demonstrated that the determination of sample size as the square root of the lot size may create a sense of false security” ↩︎
-
the total number of devices in my earlier example ↩︎
